The average golfer in England is not what you might think!
Woodhall Spa-based governing body, England Golf, have published their latest state of the nation stats on participation in the game.

Have you ever wondered what golf really looks like in England?
Well, these fascinating stats from England Golf reveal all.
The governing body have published their latest state of the nation stats on golf in the country.
Unsurprisingly, golf club membership remains extremely healthy, with more than 730,000 paying annual subscriptions in England.
The average handicap for men is 17.38 whilst that figure is 28.09 for women.
Overall, the average age of golf club members has reduced from 56.18 to 54.99.
It was a record-breaking year, with more than 10.2million scores submitted through the WHS.
That number saw competition scores grow to 5.7m (from 5.4million in 2023), while general play scores saw an enormous increase from 3.9million to 4.4million in the same period.
Scroll down to see a more detailed analysis...
Affiliated golf clubs
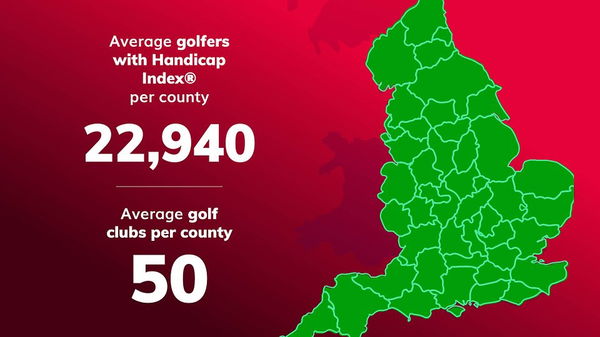
There are 1735 golf clubs in England, which averages to 49.8 golf clubs per county.
Club membership
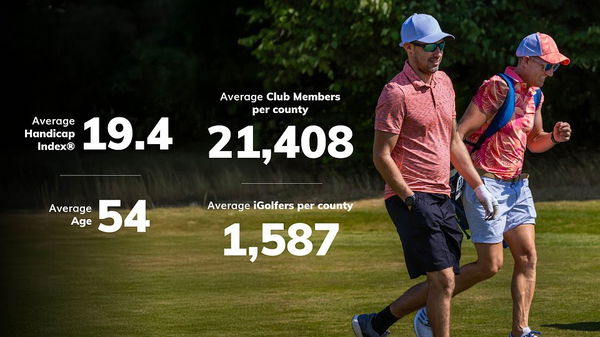
- There are more than 730,000 golf club members in England
- The average handicap in England is 18.62 (male 17.38, female 28.09)
- The average age of golf club members, both male and female, has decreased.
- The average male has gone from 54.98 to 53.78.
- The average age for female members has dropped from 64.65 to 62.98.
- Overall, the average age of golf club members has reduced from 56.18 to 54.99.
iGolfers
- iGolfers make up for seven per cent of golfers with a handicap index.
- iGolgers accounted for 494,000 scores submitted in 2024
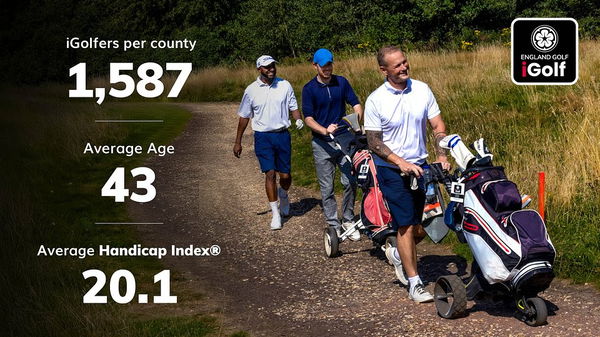
- There are more than 55,000 iGolf subscribers in England, with the average country including 1,587.
- Middlesex and London has the highest representation of iGolfers (12.24 per cent)
- The average handicap index of an iGolfer is 20.07
iGolfers and club membership combined
- There are more than 785,000 golfers in England with an official handicap index.
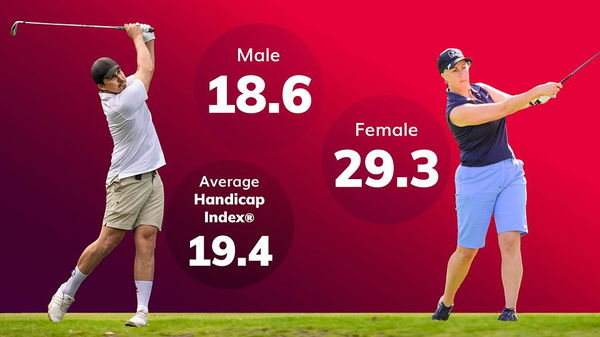
- The average handicap index of all golfers in England is 19.37 (male 18.6, female 29.33)
- The average age of all golfers with a handicap index in England is 54.14
- The average age of males has dropped from 54.16 to 52.96
- The average age of females has dropped from 64.21 to 62.61
Rank | County | Golfers |
1 | Yorkshire | 74927 |
2 | Lancashire | 52341 |
3 | Surrey | 51803 |
4 | Berks, Bucks & Oxon | 42449 |
5 | Cheshire | 40822 |
6 | Kent | 36790 |
7 | Hampshire, Isle of Wight & Channel Islands | 35680 |
8 | Essex | 32887 |
9 | Sussex | 28903 |
10 | Hertfordshire | 28830 |
11 | Gloucestershire | 21331 |
12 | Staffordshire | 20833 |
13 | Durham | 20787 |
14 | Warwickshire | 20046 |
15 | Lincolnshire | 19815 |
16 | Middlesex & London | 19743 |
17 | Devon | 18698 |
18 | Northumberland | 16346 |
19 | Suffolk | 16072 |
20 | Dorset | 15663 |
21 | Somerset | 15055 |
22 | Nottinghamshire | 15043 |
23 | Worcestershire | 14726 |
24 | Norfolk | 13998 |
25 | Leicestershire & Rutland | 13860 |
26 | Wiltshire | 13194 |
27 | Cornwall | 12731 |
28 | Derbyshire | 11341 |
29 | Bedfordshire | 10967 |
30 | Shropshire & Herefordshire | 10665 |
31 | Northamptonshire | 10523 |
32 | Cambridgeshire | 10375 |
33 | Cumbria | 9861 |
34 | Isle of Man | 2850 |
Rank | County | Handicap Index |
1 | Isle of Man | 16.65 |
2 | Surrey | 18.25 |
3 | Kent | 18.41 |
4 | Cumbria | 18.64 |
5 | Nottinghamshire | 18.67 |
6 | Durham | 18.79 |
7 | Hertfordshire | 18.8 |
8 | Essex | 18.8 |
9 | Northumberland | 18.82 |
10 | Leicestershire & Rutland | 18.94 |
11 | Middlesex & London | 19.02 |
12 | Cheshire | 19.04 |
13 | Warwickshire | 19.06 |
14 | Bedfordshire | 19.28 |
15 | Berks, Bucks & Oxon | 19.29 |
16 | Northamptonshire | 19.29 |
17 | Lancashire | 19.34 |
18 | Gloucestershire | 19.39 |
19 | Derbyshire | 19.54 |
20 | Wiltshire | 19.55 |
21 | Yorkshire | 19.59 |
22 | Sussex | 19.63 |
23 | Shropshire & Herefordshire | 19.81 |
24 | Dorset | 19.92 |
25 | Staffordshire | 20.14 |
26 | Somerset | 20.18 |
27 | Lincolnshire | 20.23 |
28 | Norfolk | 20.3 |
29 | Hampshire, Isle of Wight & Channel Islands 20.31 | 20.31 |
30 | Devon | 20.5 |
31 | Worcestershire | 20.52 |
32 | Cornwall | 20.56 |
33 | Suffolk | 20.66 |
34 | Cambridgeshire | 20.93 |
Rank | County | Age |
1 | Middlesex & London | 47.75 |
2 | Essex | 48.43 |
3 | Gloucestershire | 48.48 |
4 | Yorkshire | 48.69 |
5 | Surrey | 48.73 |
6 | Durham | 48.75 |
7 | Cambridgeshire | 48.84 |
8 | Northamptonshire | 48.86 |
9 | Kent | 48.93 |
9 | Cornwall | 48.93 |
11 | Lancashire | 48.96 |
12 | Suffolk | 49.00 |
13 | Staffordshire | 49.05 |
14 | Shropshire & Herefordshire | 49.09 |
15 | Somerset | 49.15 |
15 | Hertfordshire | 49.15 |
17 | Bedfordshire | 49.19 |
18 | Berks, Bucks & Oxon | 49.36 |
19 | Cumbria | 49.41 |
19 | Lincolnshire | 49.41 |
21 | Cheshire | 49.42 |
22 | Leicestershire & Rutland | 49.44 |
23 | Derbyshire | 49.49 |
23 | Norfolk | 49.49 |
25 | Isle of Man | 49.52 |
26 | Northumberland | 49.60 |
27 | Hampshire, Isle of Wight & Channel Islands | 49.75 |
28 | Nottinghamshire | 49.8 |
29 | Warwickshire | 49.90 |
29 | Sussex | 49.90 |
31 | Devon | 49.98 |
32 | Worcestershire | 50.06 |
32 | Wiltshire | 50.06 |
34 | Dorset | 50.22 |


